Insight
Evolving Manufacturing Performance Management from Reporting to Flow Control
Most plants have more data today ever: OEE dashboards, real-time throughput by the hour, and quality defect rates
Learn More
Supply Chain disruptions required network redesigns. Tariffs prompted nearshoring reviews. Labor cost shifts moved manufacturing footprints. Energy volatility changed distribution economics. Most organizations ran models and many committed capital.
While some of those designs are performing, many are not. Failures are not due to flawed modeling, but rather assumptions that looked reasonable on paper and collapsed under real operating conditions.
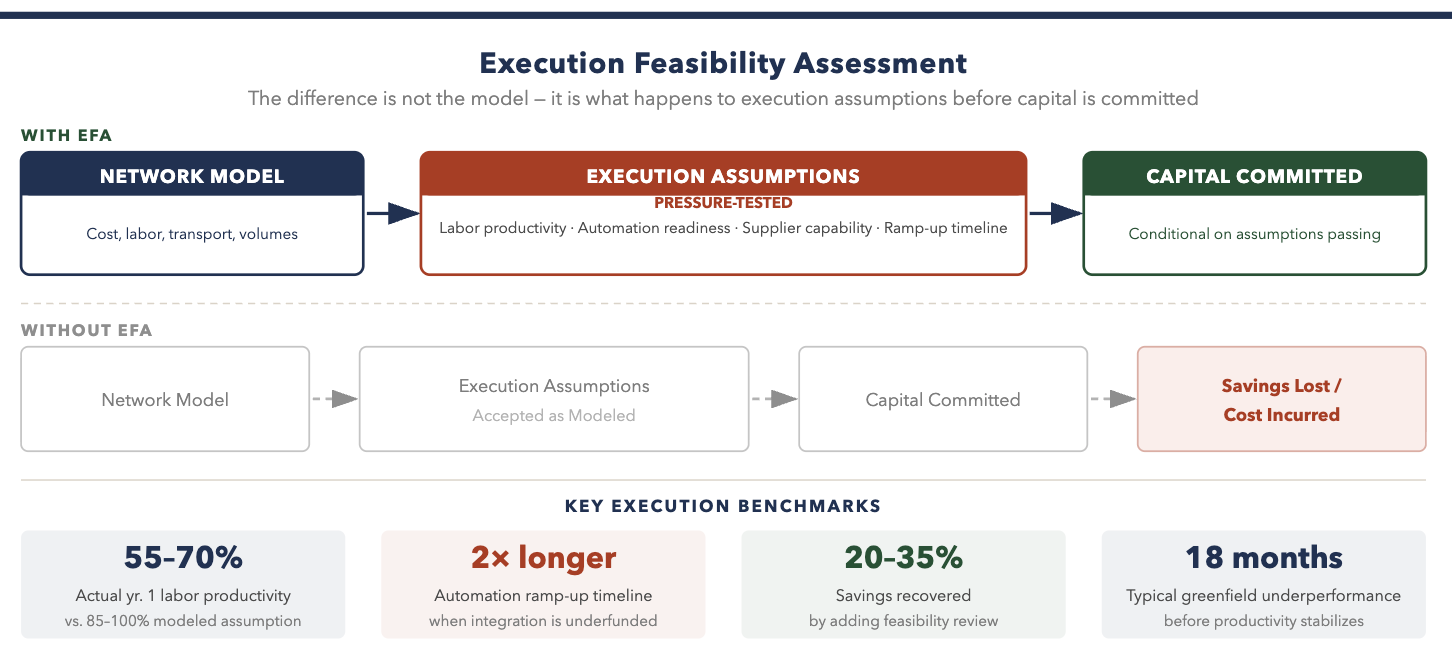
Labor productivity at a greenfield site often runs 30-40% below model assumptions for the first 18 months. Automation ramp-up often take twice as long when integration dependencies are underfunded. Supplier reliability in nearshore locations improves more slowly than procurement projects. These are not edge cases – they are the most common failure patterns in network execution. And these failure rates grow exponentially when market forces converge more acutely.
In 2026, the question is not whether a network design looks good in a model. It is whether the design can be executed — with current labor availability, automation maturity, and supplier capability.
When we model network designs, we stress test assumptions with our Execution Feasibility Assessment — a structured test of whether designs hold under real constraints before capital is committed. We embed (Gen)AI throughout the framework, including agents that rapidly ingest and analyze of structured data and documents. We test assumptions against market conditions the original model didn’t consider.
Sophisticated network models produce accurate cost estimates using assumed conditions. The assumptions carry most of the risk, and the assumptions that break most often include:
A Tier 1 automotive supplier consolidated two stamping operations into a new facility following a network review that showed $14M in annual savings. The model “mathed”, however labor productivity at the new site ran 62% of target through month 12. Automation integration slipped 7 months. The resulting service disruptions cost $8M in expediting, premium freight, and customer penalties in the first year.
Under an Execution Feasibility Assessment, each major design assumption is tested against reference data: actual ramp-up curves from comparable sites, integration timeline data from automation vendors, fill rate history from nominated suppliers. We also cross-reference assumptions against external macro signals (tariff trends, freight rates, labor availability), not just internal data. Capital is conditional on those tests passing.
We leverage AI and machine learning to run simulations across multiple scenarios in parallel, not sequentially, to compress the time requirements and improve confidence in strategy and ensuing capital commitment. We use GenAI to rapidly prototype solutions (e.g., simple process automation “bots”) accelerate insights and sharpen the business case.
Network designs fail in execution when operational owners are not brought in when the strategy is being set. The assumptions that break hardest are the ones supply chain, operations, and HR did not review.
The ownership structure that works:
The failure pattern is consistent: strategy teams design in isolation, present the business case, and hand-off to operations after approval. . Operations then spends 18 months trying to hit numbers they had little part in setting and are often unachievable.
Most organizations have the data to stress-test network assumptions.
Feasibility signals worth tracking:
Reference data on actual ramp-up curves already exists inside most large manufacturers, and increasingly, AI tools can surface more patterns and deeper insights faster than any manual review. It is just not applied systematically at capital approval. One organization found that every network investment approved in 2023 and 2024 embedded labor productivity assumptions in the top quartile of their own historical data — with no documentation, no risk adjustment, and no one accountable for hitting them.
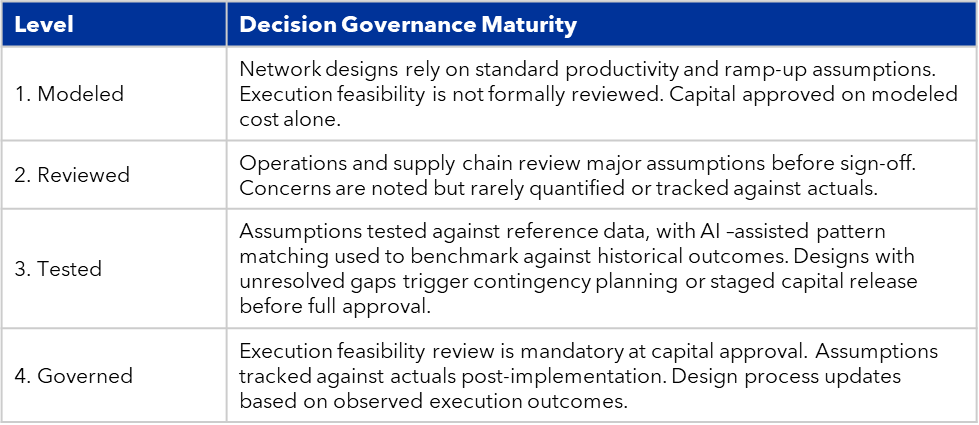
Organizations progress through four stages as execution feasibility becomes embedded in strategy.
Organizations that add execution feasibility review typically recover 20-35% of projected savings that would otherwise be lost to ramp-up failure and assumption gaps in year 1.
Network strategy success is rarely a modeling problem. The organizations committing capital with confidence are the ones that have closed the gap between what the model assumes and what the operating system can actually deliver.

Most plants have more data today ever: OEE dashboards, real-time throughput by the hour, and quality defect rates
Learn More
Many planning teams set out to improve, and they focused on forecast accuracy building scenario tools, creating real
Learn More
Excess inventory exists not because strategy is unclear, but because trade-offs are fragmented. A planner adds buffer to protect service. A plant batches to
Learn More
Uncertainty remains “the constant” as we turn the page to 2026. Tariffs, labor constraints, bifurcated consumer sentiment, working
Learn More